


Using Geographic Information System to Track Children and Optimize Immunization Coverage and Equity in Karachi, Pakistan
Affiliation
IRD Pakistan (Siddique, Iftikhar, Dharma, Chandir); IRD Global (Shah, Siddiqi, Malik, Chandir)
Date
Summary
"Making immunization inequities visible through geospatial analysis is the first step to ensure resources are allocated optimally."
Digital tools such as high-resolution mapping are gaining increasing recognition for their potential to improve vaccination coverage in low- and middle-income countries (LMICs). Geographic Information Systems (GIS) are computer programmes that can store, visualise, and analyse geospatial data and model spatial processes to uncover operations and situations on the ground. This study conducted a geospatial analysis using provincial electronic immunisation registry data from Sindh province, Pakistan, to explore the geographic and temporal trends of immunisation coverage in Karachi city from 2018 to 2020.
Karachi includes 8 super-high-risk union councils (SHRUCs) - polio-endemic areas that pose the most significant risk due to dense, underserved population groups with low levels of polio vaccination. Approximately 78% of vaccinations in the city are offered at fixed centres, with the remainder administered via routine outreach sessions and enhanced outreach activities. The study used data from the Government of Sindh's Zindagi Mehfooz (Safe Life) Electronic Immunization Registry (SEIR), an Android-based system that allows vaccinators to enrol and follow up with children using cell phones. It enables real-time recording of child immunisation data at the individual level, web-based monitoring, and resource mobilisation. The primary outcome was geospatial analysis to assess geographic variation in coverage rates of Bacille Calmette-Guerin (BCG), first dose of Pentavalent (Diphtheria, Pertussis, Tetanus, Hepatitis B, and Hib), third dose of Pentavalent (Penta-3), and Measles-1 vaccines.
Analysis of SEIR immunisation records for 1,298,555 children born, enrolled or vaccinated from 2018 to 2020 in Karachi, Pakistan, found that, at the district level, coverage increased between 2018 and 2019 and declined in 2020, while analysis by vaccination year showed consistent increase in coverage. However, micro-geographic analysis revealed pockets where coverage persistently declined. There were 27 (16.1%) UCs demonstrating a consistent downward trend in the coverage rates for all four antigens for cohorts enrolled in 2018, 2019 and 2020. Almost half of these UCs (40.7%; 11/27) were in slums.
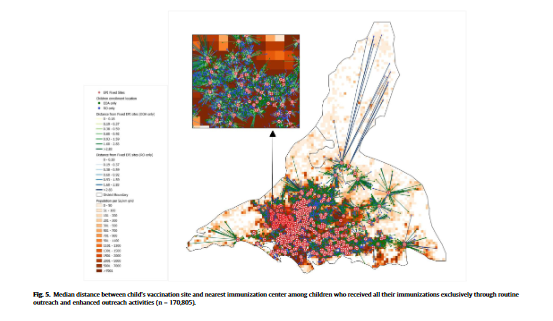
Furthermore, more than half (52.2%, 678,280/1,298,555) of the children received all their vaccinations exclusively through fixed centres, and 71.7% (499,391/696,701) received all vaccinations from the same centres. Around 1 in 20 children are only vaccinated through extended outreach activities and would remain unreached if such activities were discontinued.
Per the researchers: "These findings emphasize the importance of geospatial analysis for revealing coverage rates at a sub-national level that could be masked when analyzing at the aggregate level. This is essential from an equity perspective as sub-national geographic analysis can help eliminate blind spots in identifying regions which are left behind and require concerted efforts to boost coverage. Inequitable coverage also results in zero-dose children, who are at increased risk of morbidity and mortality as a result of persistently missing life-saving vaccines."
"Granular geo-spatial analysis can therefore help identify these hotspots of low and declining coverage rates so that data-driven, appropriate remedial actions can be directed towards these regions. The Health Department and other stakeholders can implement strategies such as organizing supplementary immunization activities (SIAs) and extended outreach activities, establishing new immunization centers, increasing involvement of the private sector, rationalizing vaccinator allocations, and focusing on behavior change and communication strategies in these areas..."
The researchers hope this study provides impetus for countries to develop and invest in geospatial technologies, harnessing their potential to facilitate equitable coverage strategies and data-driven decisions to achieve universal coverage.
Digital tools such as high-resolution mapping are gaining increasing recognition for their potential to improve vaccination coverage in low- and middle-income countries (LMICs). Geographic Information Systems (GIS) are computer programmes that can store, visualise, and analyse geospatial data and model spatial processes to uncover operations and situations on the ground. This study conducted a geospatial analysis using provincial electronic immunisation registry data from Sindh province, Pakistan, to explore the geographic and temporal trends of immunisation coverage in Karachi city from 2018 to 2020.
Karachi includes 8 super-high-risk union councils (SHRUCs) - polio-endemic areas that pose the most significant risk due to dense, underserved population groups with low levels of polio vaccination. Approximately 78% of vaccinations in the city are offered at fixed centres, with the remainder administered via routine outreach sessions and enhanced outreach activities. The study used data from the Government of Sindh's Zindagi Mehfooz (Safe Life) Electronic Immunization Registry (SEIR), an Android-based system that allows vaccinators to enrol and follow up with children using cell phones. It enables real-time recording of child immunisation data at the individual level, web-based monitoring, and resource mobilisation. The primary outcome was geospatial analysis to assess geographic variation in coverage rates of Bacille Calmette-Guerin (BCG), first dose of Pentavalent (Diphtheria, Pertussis, Tetanus, Hepatitis B, and Hib), third dose of Pentavalent (Penta-3), and Measles-1 vaccines.
Analysis of SEIR immunisation records for 1,298,555 children born, enrolled or vaccinated from 2018 to 2020 in Karachi, Pakistan, found that, at the district level, coverage increased between 2018 and 2019 and declined in 2020, while analysis by vaccination year showed consistent increase in coverage. However, micro-geographic analysis revealed pockets where coverage persistently declined. There were 27 (16.1%) UCs demonstrating a consistent downward trend in the coverage rates for all four antigens for cohorts enrolled in 2018, 2019 and 2020. Almost half of these UCs (40.7%; 11/27) were in slums.
Furthermore, more than half (52.2%, 678,280/1,298,555) of the children received all their vaccinations exclusively through fixed centres, and 71.7% (499,391/696,701) received all vaccinations from the same centres. Around 1 in 20 children are only vaccinated through extended outreach activities and would remain unreached if such activities were discontinued.
Per the researchers: "These findings emphasize the importance of geospatial analysis for revealing coverage rates at a sub-national level that could be masked when analyzing at the aggregate level. This is essential from an equity perspective as sub-national geographic analysis can help eliminate blind spots in identifying regions which are left behind and require concerted efforts to boost coverage. Inequitable coverage also results in zero-dose children, who are at increased risk of morbidity and mortality as a result of persistently missing life-saving vaccines."
"Granular geo-spatial analysis can therefore help identify these hotspots of low and declining coverage rates so that data-driven, appropriate remedial actions can be directed towards these regions. The Health Department and other stakeholders can implement strategies such as organizing supplementary immunization activities (SIAs) and extended outreach activities, establishing new immunization centers, increasing involvement of the private sector, rationalizing vaccinator allocations, and focusing on behavior change and communication strategies in these areas..."
The researchers hope this study provides impetus for countries to develop and invest in geospatial technologies, harnessing their potential to facilitate equitable coverage strategies and data-driven decisions to achieve universal coverage.
Source
Vaccine, Volume 41, Issue 18, 2 May 2023, Pages 2922-31. https://doi.org/10.1016/j.vaccine.2023.03.051.
- Log in to post comments